Data Analyzing
Data analysis software: Analyzer

A single f(s)NISDAS can display all of the charts that are required.
Up to 16 channels can be displayed on a single chart, and several items of data can easily be set on the channels.
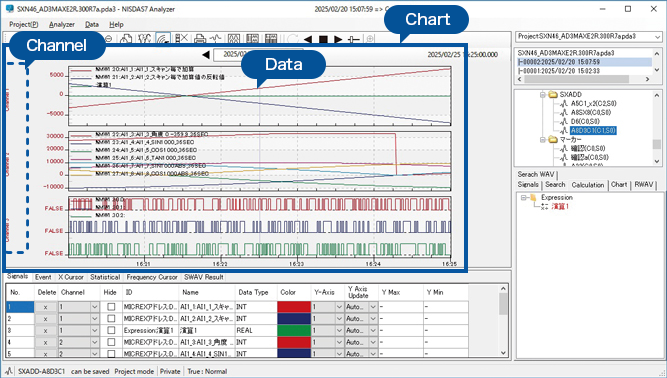

If multiple data are set for one channel, the y-axis can be divided.

-
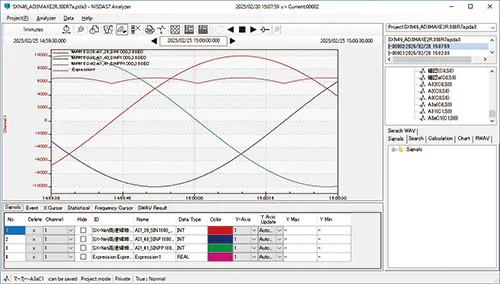
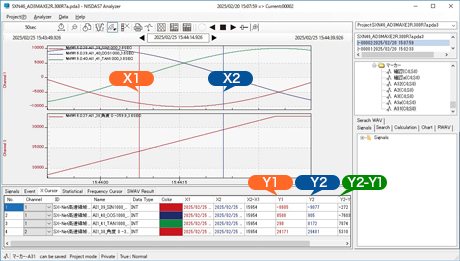
X cursor
By aligning the first cursor (X1) and the second cursor (X2) at any position, each of the time values (Y1 and Y2) can be easily read. At the same time, each of the deviations (X2-X1 and Y2-Y1) can be calculated and displayed.
-
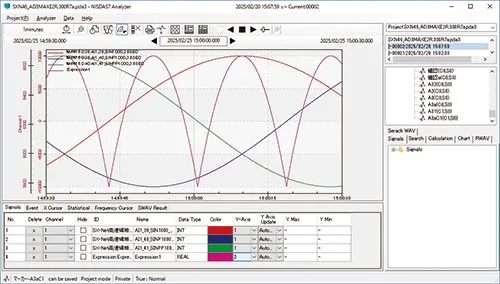
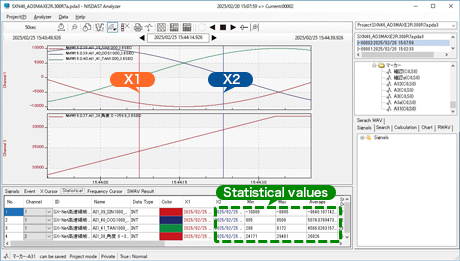
Statistics cursor
Statistical values on each of the data within the period marked between the first cursor (X1) and the second cursor (X2) are calculated and displayed in a list.-
Maximum value
-
Minimum value
-
Average value
-
Standard deviation
-
Median value
-
Most frequent value
-
Distributed value
-
Root-mean-square
-
-
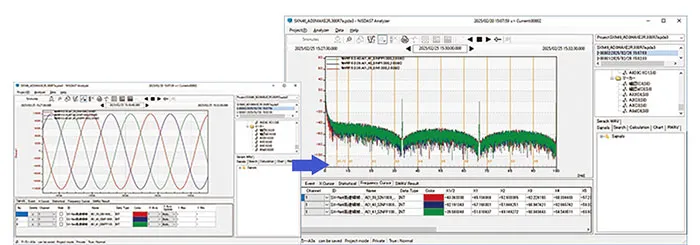
High-speed Fourier transform, power spectrum