Operability
Simplified operation 〜Easier to use〜
File conversion tool:DIz2Gat
Data copy tool:PdaDataCopyTool

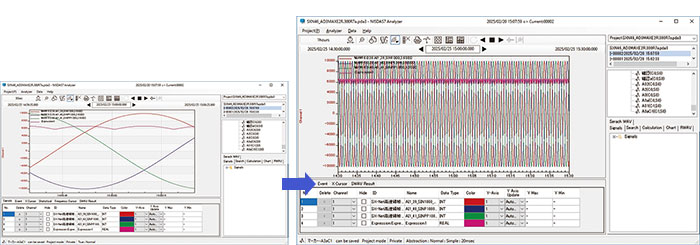
Intuitive operations make it easy to acquire, display and analyze data.

A long time waveform can be displayed. If the display time is extended while the acquired data is being displayed without thinning (true waveform mode), when the total number of points exceeds the maximum number of plot points, the displayed data is aggregated and the waveform switches to a long time waveform(abstract waveform mode).

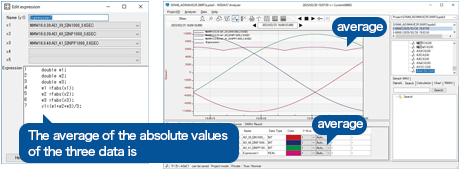
The chart display method can be arbitrarily input by user in the form of an operation expression, thereby enhancing the degree of freedom for chart expression.
-
Examples of display settings
-
Conversion to industrial value
-
Offset addition
-
Scale conversion
-
Difference operation
-
Integration operation
-
Filter setting
-

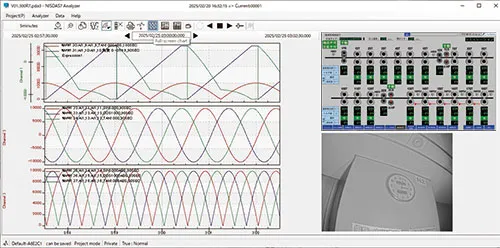
You can display charts and network video recorders together.
You can analyze events while synchroniz-ing the recorded video and the chart of the production facility on the same screen.

The acquired data for a required period can be extracted and saved as a single file. Only the data when an abnormality occurred can also be extracted and reproduced on another PC or stored as a backup.The file is saved in a special format.Data can be restored and analyzed immediately with the restore tool.

You can register any waveform as a reference waveform and search for similar waveforms. In addition, various searches can be performed by describing conditions such as moving average values.

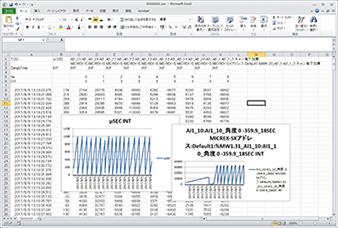
You can convert the collected data into a text (CSV) format by specifying optional items and filters. Conversion allows spreadsheet software to analyze collected data. For example, it can be analyzed by Microsoft®Excel (right-hand figure). The utility of collected data can be further enhanced by utilizing the functions of commercially available software.

You can automatically convert the collected data to CSV format by specifying optional items and filters. The conversion file is stored in the specified folder. Storage is performed while maintaining a certain number.
Up to three ACQ. The storage location is specified individually. The conversion is done every 15 or 60 minutes. You should set this value taking into account the collection interval, the number of items, and PC performance.

The object of chart display can be printed.
Detailed chart information can be specified and printed.