Monitoring operation functions
Excellent visibility and operability enable timely and accurate understanding of the situation
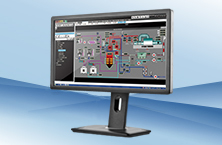
Excellent visibility is achieved with full high definition (HD) and dual monitor compatibility.
Outstanding operability enables operations to be performed not only on PCs but also on tablets.
Comes standard with a wide array of parts that facilitate plant panel construction. It comes standard with various functions required for plant operation, such as power demand(*1) and PID auto tuning.
Free format forms can be created using form functions(*1) based on Excel.
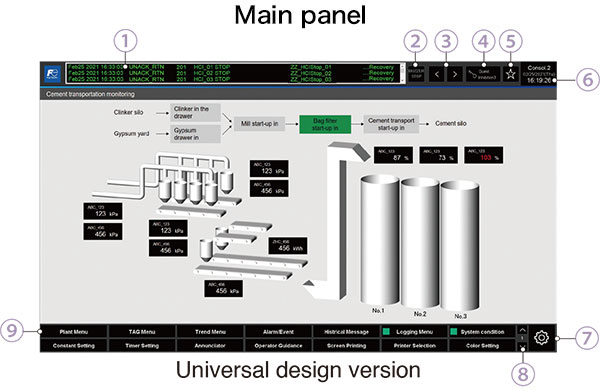
① Alarm bar: Shows the latest alarms
② Alarm stop
③ Moves back and forward between panels
④ Operator level
⑤ Favorites menu link
⑥ Clock function
⑦ Settings menu link
⑧ Lower menu: Supports multiple switching
⑨ Lower menu: Enables single click calling of frequently used functions
Excellent operability and visibility
The main panel prominently displays only important alerts, provides better contrast between background and text colors, and adopts a simple panel that makes it possible to identify the operating status at a glance. Moreover, it enhances visibility by making it easier to see on small tablet panels by increasing the size of trend displays, etc. It inherits the sophisticated feel of the classic version, but provides better operability and visibility.
Color scheme designed for easy viewing
The main panel also takes into consideration color vision diversity by reducing dark colors, since they make the panel difficult to view due to sunlight reflection, while making it easier to distinguish between colors. It adopts a color scheme that accurately conveys information to all users. The color scheme makes it easier to view, regardless of location or operator skill.
UI that prevents misoperation
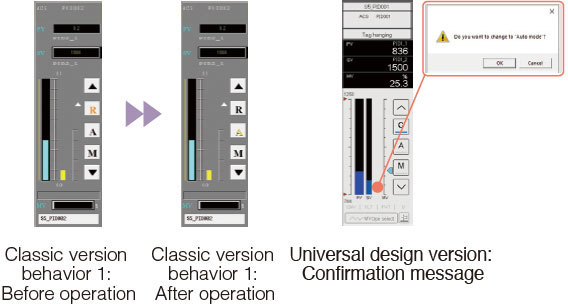
The UI enhances the spacing between operation components and its layout helps prevent misoperation even on mobile devices. It displays a confirmation message when pressing a wrong button. This reduces the risk of making operation mistakes. The UI’s behavior settings can be changed freely. This makes it is possible to have different operating behaviors depending on what device you are using it on, whether PC or tablet.
Flexible design
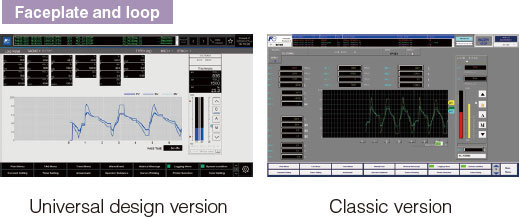
For people who want to continue using the conventional design, it enables operators to switch between the classic version and universal design version. This means that operators can use whichever design they prefer. It also adopts a highly flexible design that allows the color scheme of the faceplate and loop to be changed to that of the classic version.
Create a versatile faceplate(*1)
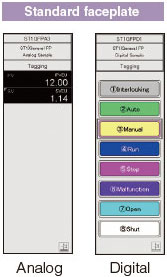
Definitions of 3 analog instrument patterns and 100 digital instrument patterns, are provided to enable users to create any type of faceplate.
The digital instrument can define 8 buttons, 16 colors, and button text, making it versatile enough to handle a variety of situations.
Like other faceplates, they can be registered and displayed in the group panel and TAG menu.
Operator-free PID auto tuning
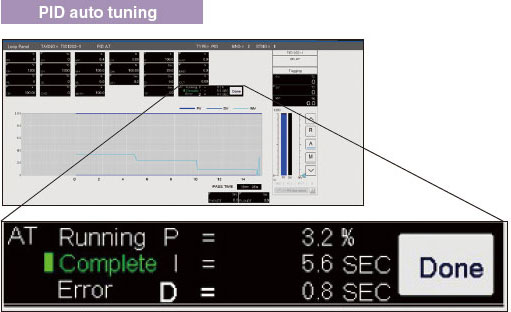
The optimum PID constants are automatically calculated and set according to the PID control target, eliminating the need for operator skills and experience.
Output system definitions in Excel format(*1)
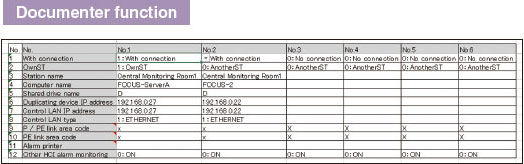
The documenter function enables batch output of FOCUS definitions, report definitions, and system information in Excel format, allowing users to check all FOCUS system definitions at a glance.
Difference check function for effective trouble prevention(*1)
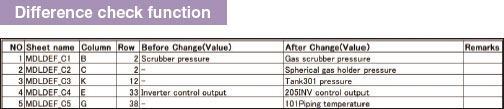
The documenter function checks for differences before and after FOCUS definition changes. It prevents system problems by outputting and confirming the changes.
Plant panel
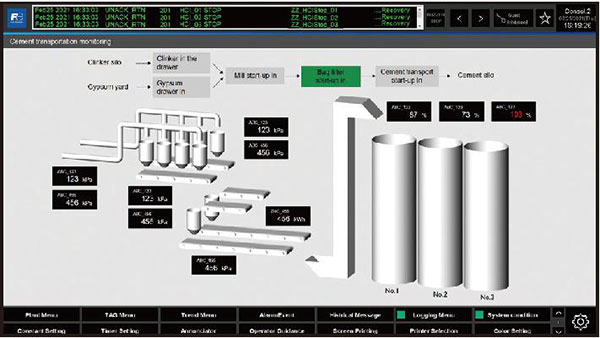
This panel makes it possible for operators to build their own original monitoring and control panels to suit their plants. Furthermore, operators can use its control panel to perform data settings, device operations, interrupt displays, and panel linkage.
Favorites menu
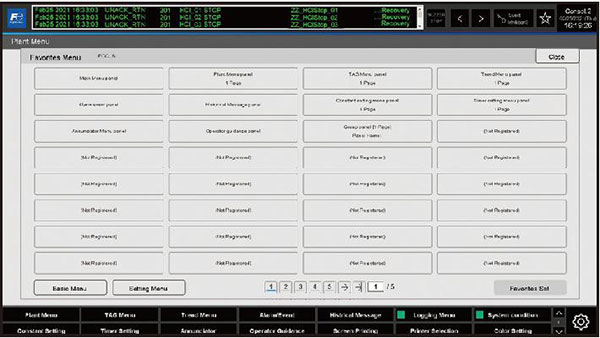
This menu can be used to register and access panels. Moreover, operators can freely register their favorite panels and access them from the menu.
Tag menu
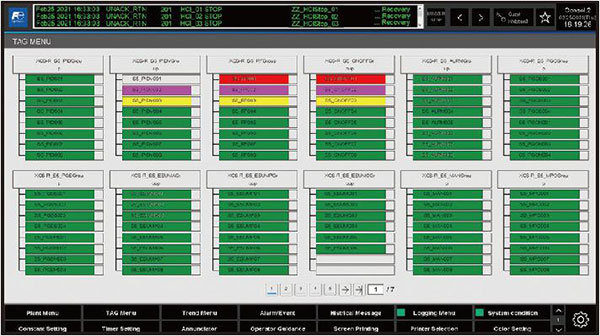
This menu enables operators to list the internal instruments being monitored by the operator station and to collectively check the internal instrument status and tagging status.
Group panel
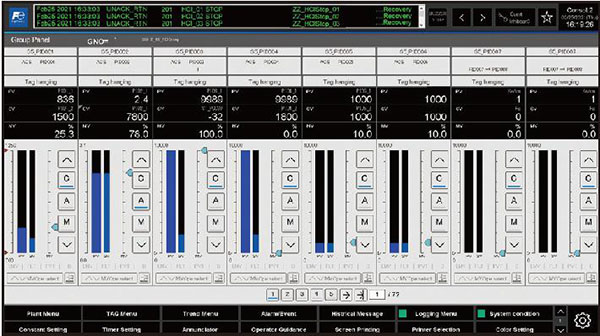
This panel displays the status of the controller’s internal instruments in user-friendly and easy-to-view formats such as bar graphs and by numerical values. It also allows operators to switch control modes and perform data setting operations.
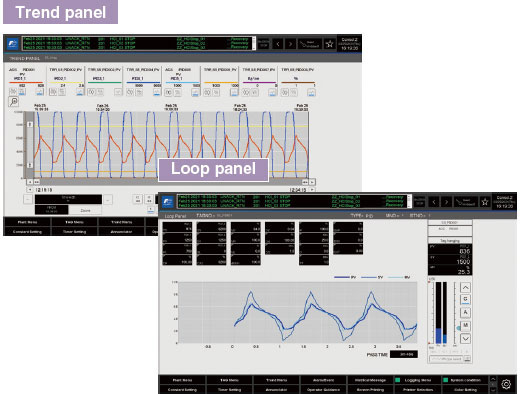
Loop panel
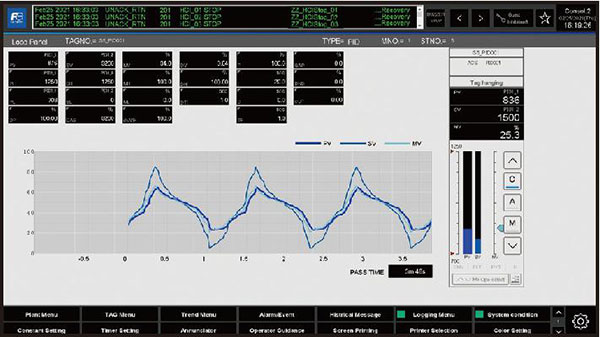
This panel displays the status of internal instruments in detail. It also enables operators to adjust the single control loop by changing the parameters of internal instruments.
Warning tag window
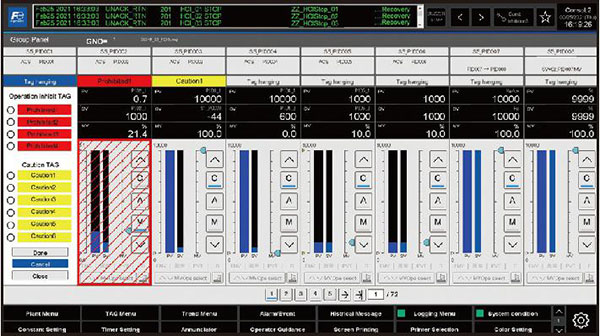
This window can tag internal instruments during maintenance and adjustment work to prevent accidental operation. There are two types of tags: operation prohibition tags (inoperable) and caution tags (operable).
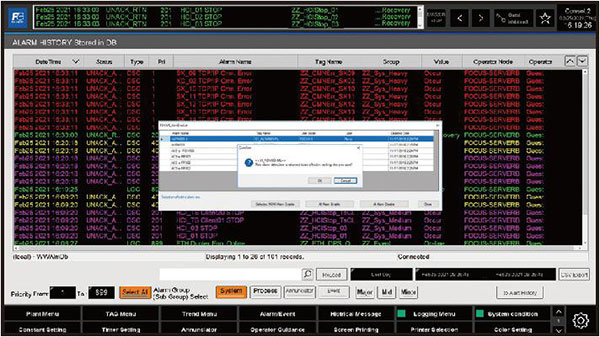
Alarm history and alarm summary panel
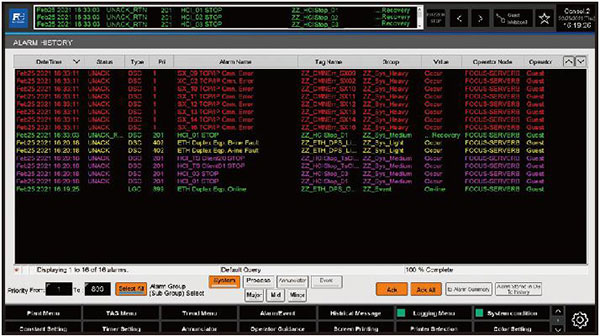
This panel enables operators to view past alarms using the alarm history and current alarms using the summary panel. It also makes possible to extract and display alarms using search strings, and output alarms and operation history in CSV format for the displayed date and time range.
Historical message panel
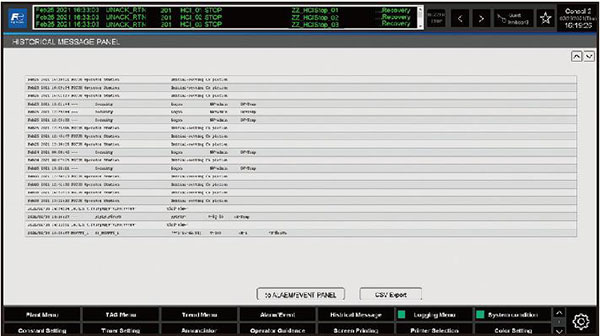
This panel displays past operation history and also displays alarm history panels called from this panel as operation history panels. It also enables operators to specify a date range and output operation history in CSV format.
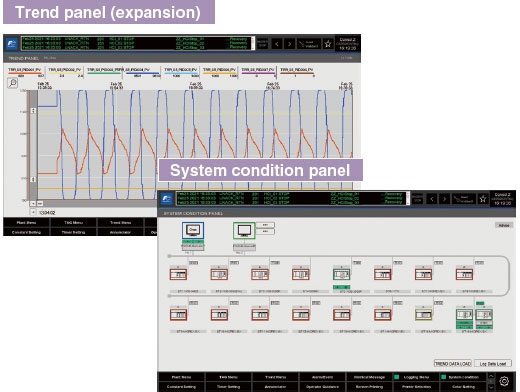
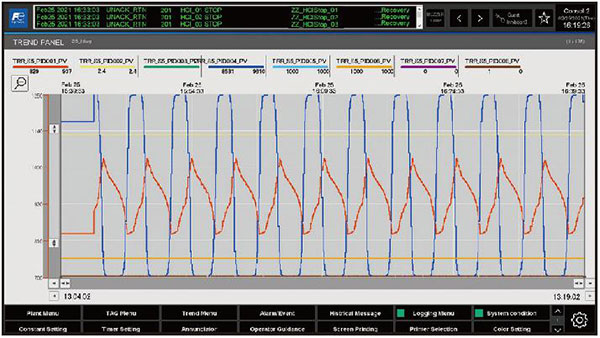
Trend panel
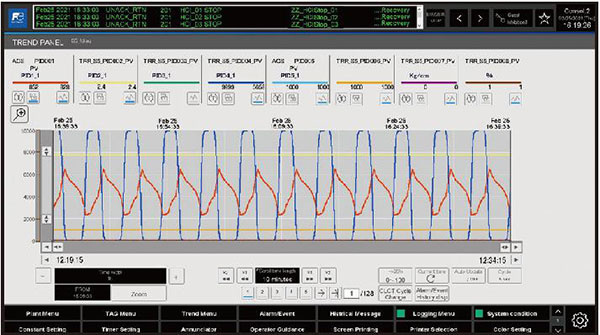
This panel enables operators to check and reassign up to 8 loops of trends. It also supports graph displays on a per pen basis and instrument pop-up displays. It displays the alarm and action history in a pop up and enables operators to narrow down results by moving the graph date and time range.
Trend panel (expansion)
This panel has been redesigned to include a new expansion and contraction function. It keeps the information in the number field to a minimum and has a panel designed specifically for easy viewing of graphs.
Logging display panel
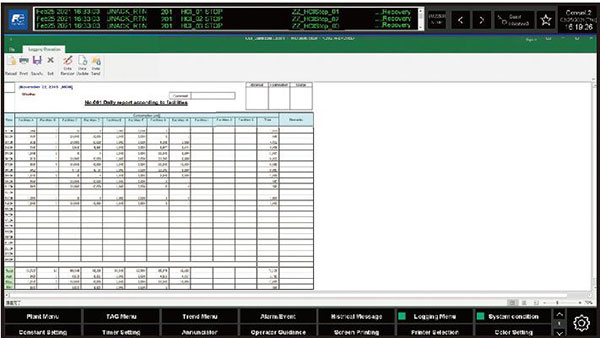
This panel enables operators to create and display daily, monthly, and annual reports in Excel format. It also enables operators to modify, update, and print data.
Weather input panel
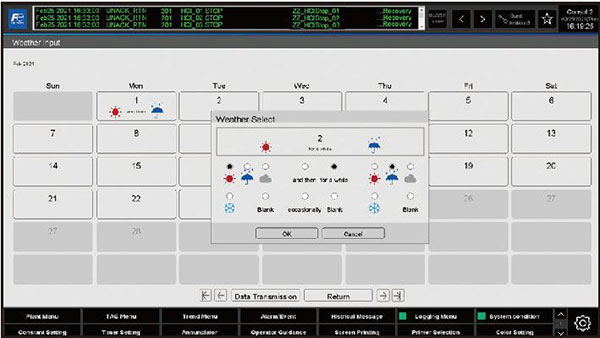
This panel can record daily weather information. The settings include weather descriptions (sunny, cloudy, rainy, snowy) and auxiliary descriptions (later, temporarily, occasionally, without).
Annunciator panel
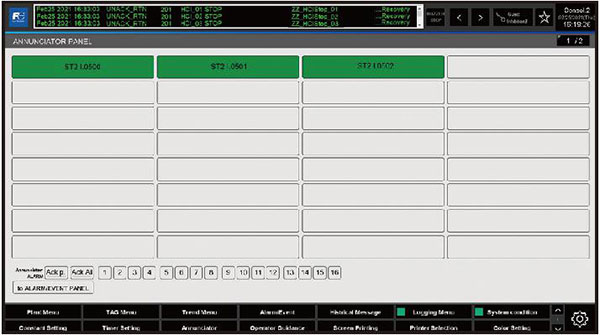
This panel displays the existence of alarms graphically, enabling operators to check for abnormalities at a glance. It also provides a button to transition to a pre-defined plant panel.
Operator guidance panel
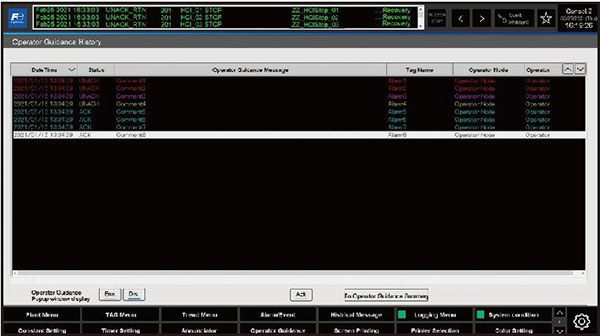
This panel provides operators with guidance and communications as needed.
System condition panel
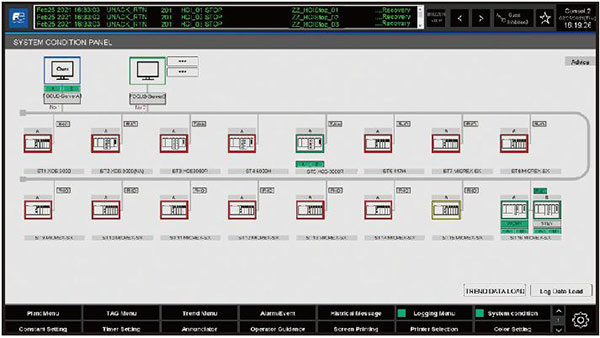
This panel can be used to graphically check the system status. Its new design now supports 16 controller displays instead of 8 controller displays per page.
Constant setting and timer value setting panel
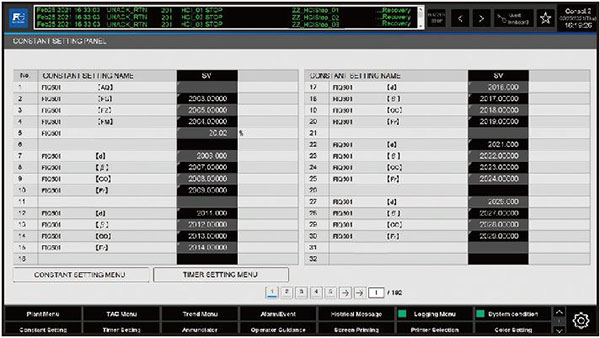
This panel enables operators to change the settings and display the present values of constants and timers used in plant operations.
Historical data CSV conversion and output panel
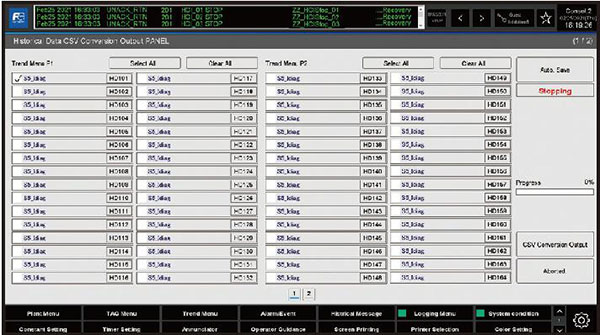
This panel can save past trend data in CSV format. Operators can also schedule automatic backups whenever they want. Furthermore, it can select output targets on a trend menu basis.
Controller memory display panel(*1)
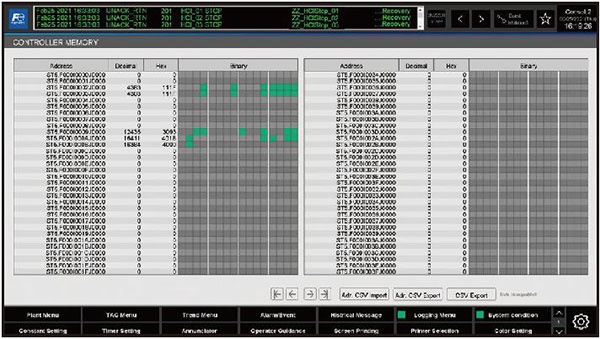
This panel enables operators to check the memory status of all connected controllers at once. It alone can be used to specify addresses of multiple controllers on a single point and to write and read address information and export it to a CSV file.
Power demand monitoring panel(*1)
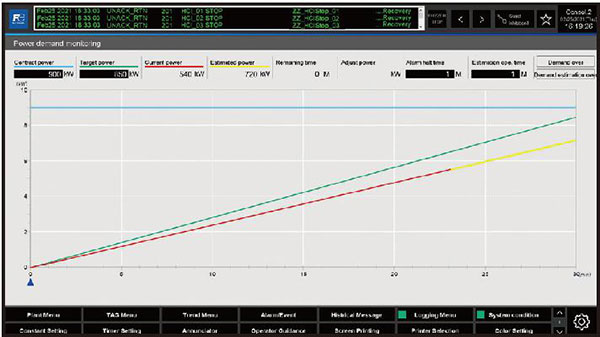
This panel displays graphs for contracted power, target power, present power, and forecasted power. It can be used to set the target power, perform forecasting calculations based on the present power, and notify operators with alarms when the forecasted power exceeds the target power.
Auto save setting window
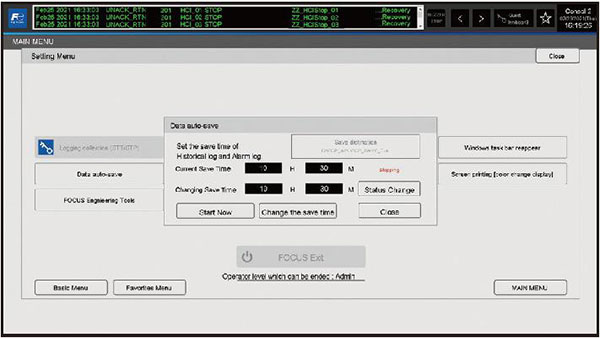
This window can be used to automatically save the previous day’s reports, trends, alarms, and operation history at specified times. Operators can specify any destination, such as an external hard disk.
Operator level switching window
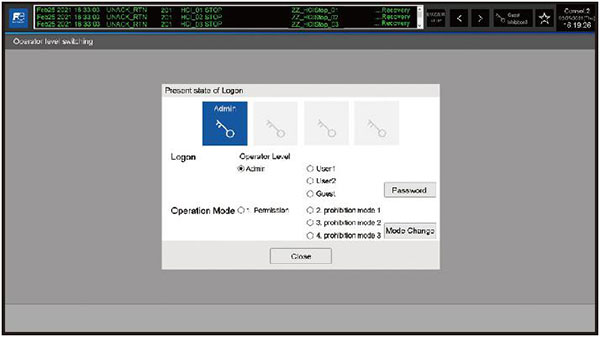
This window can be used to change data manipulation privileges at four levels, from master administrator to guest.
Soft keyboard window
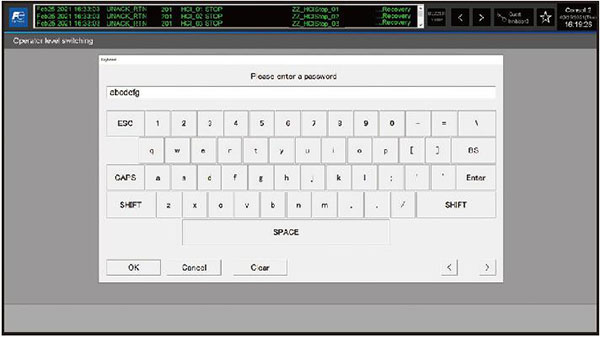
This window enables operators to enter text and numbers without using a physical keyboard. Its large button display makes it easy to input data through touch operations even on tablets with small screens.
Alarm management setting window
This window can mask unwanted alarms and reduce operator loads. In addition to masking on a single point basis during operation, it can also be set to perform masking for each equipment group before starting operation.
Color change and print setting window
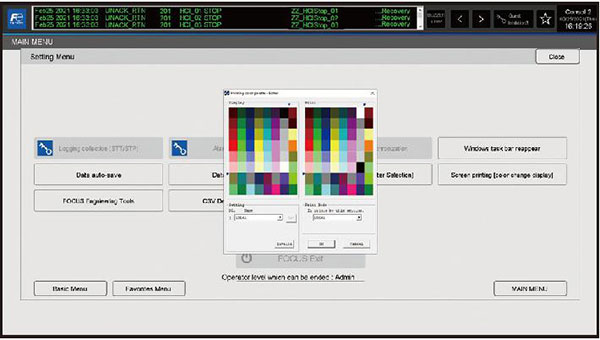
This window enables operators to change the color of the background from black to white to reduce ink consumption, or change the color as necessary to allow printing with clear colors.
-
*1
-
This feature will be also available on MICREX-View FOCUS Evolution in future.